
Prerequisites & Requirements
- Owner or Manager role.
FloCafe’s Dashboard provides actionable real-time business intelligence: see today’s total sales, average ticket size, and which menu items drive the highest profit margins.
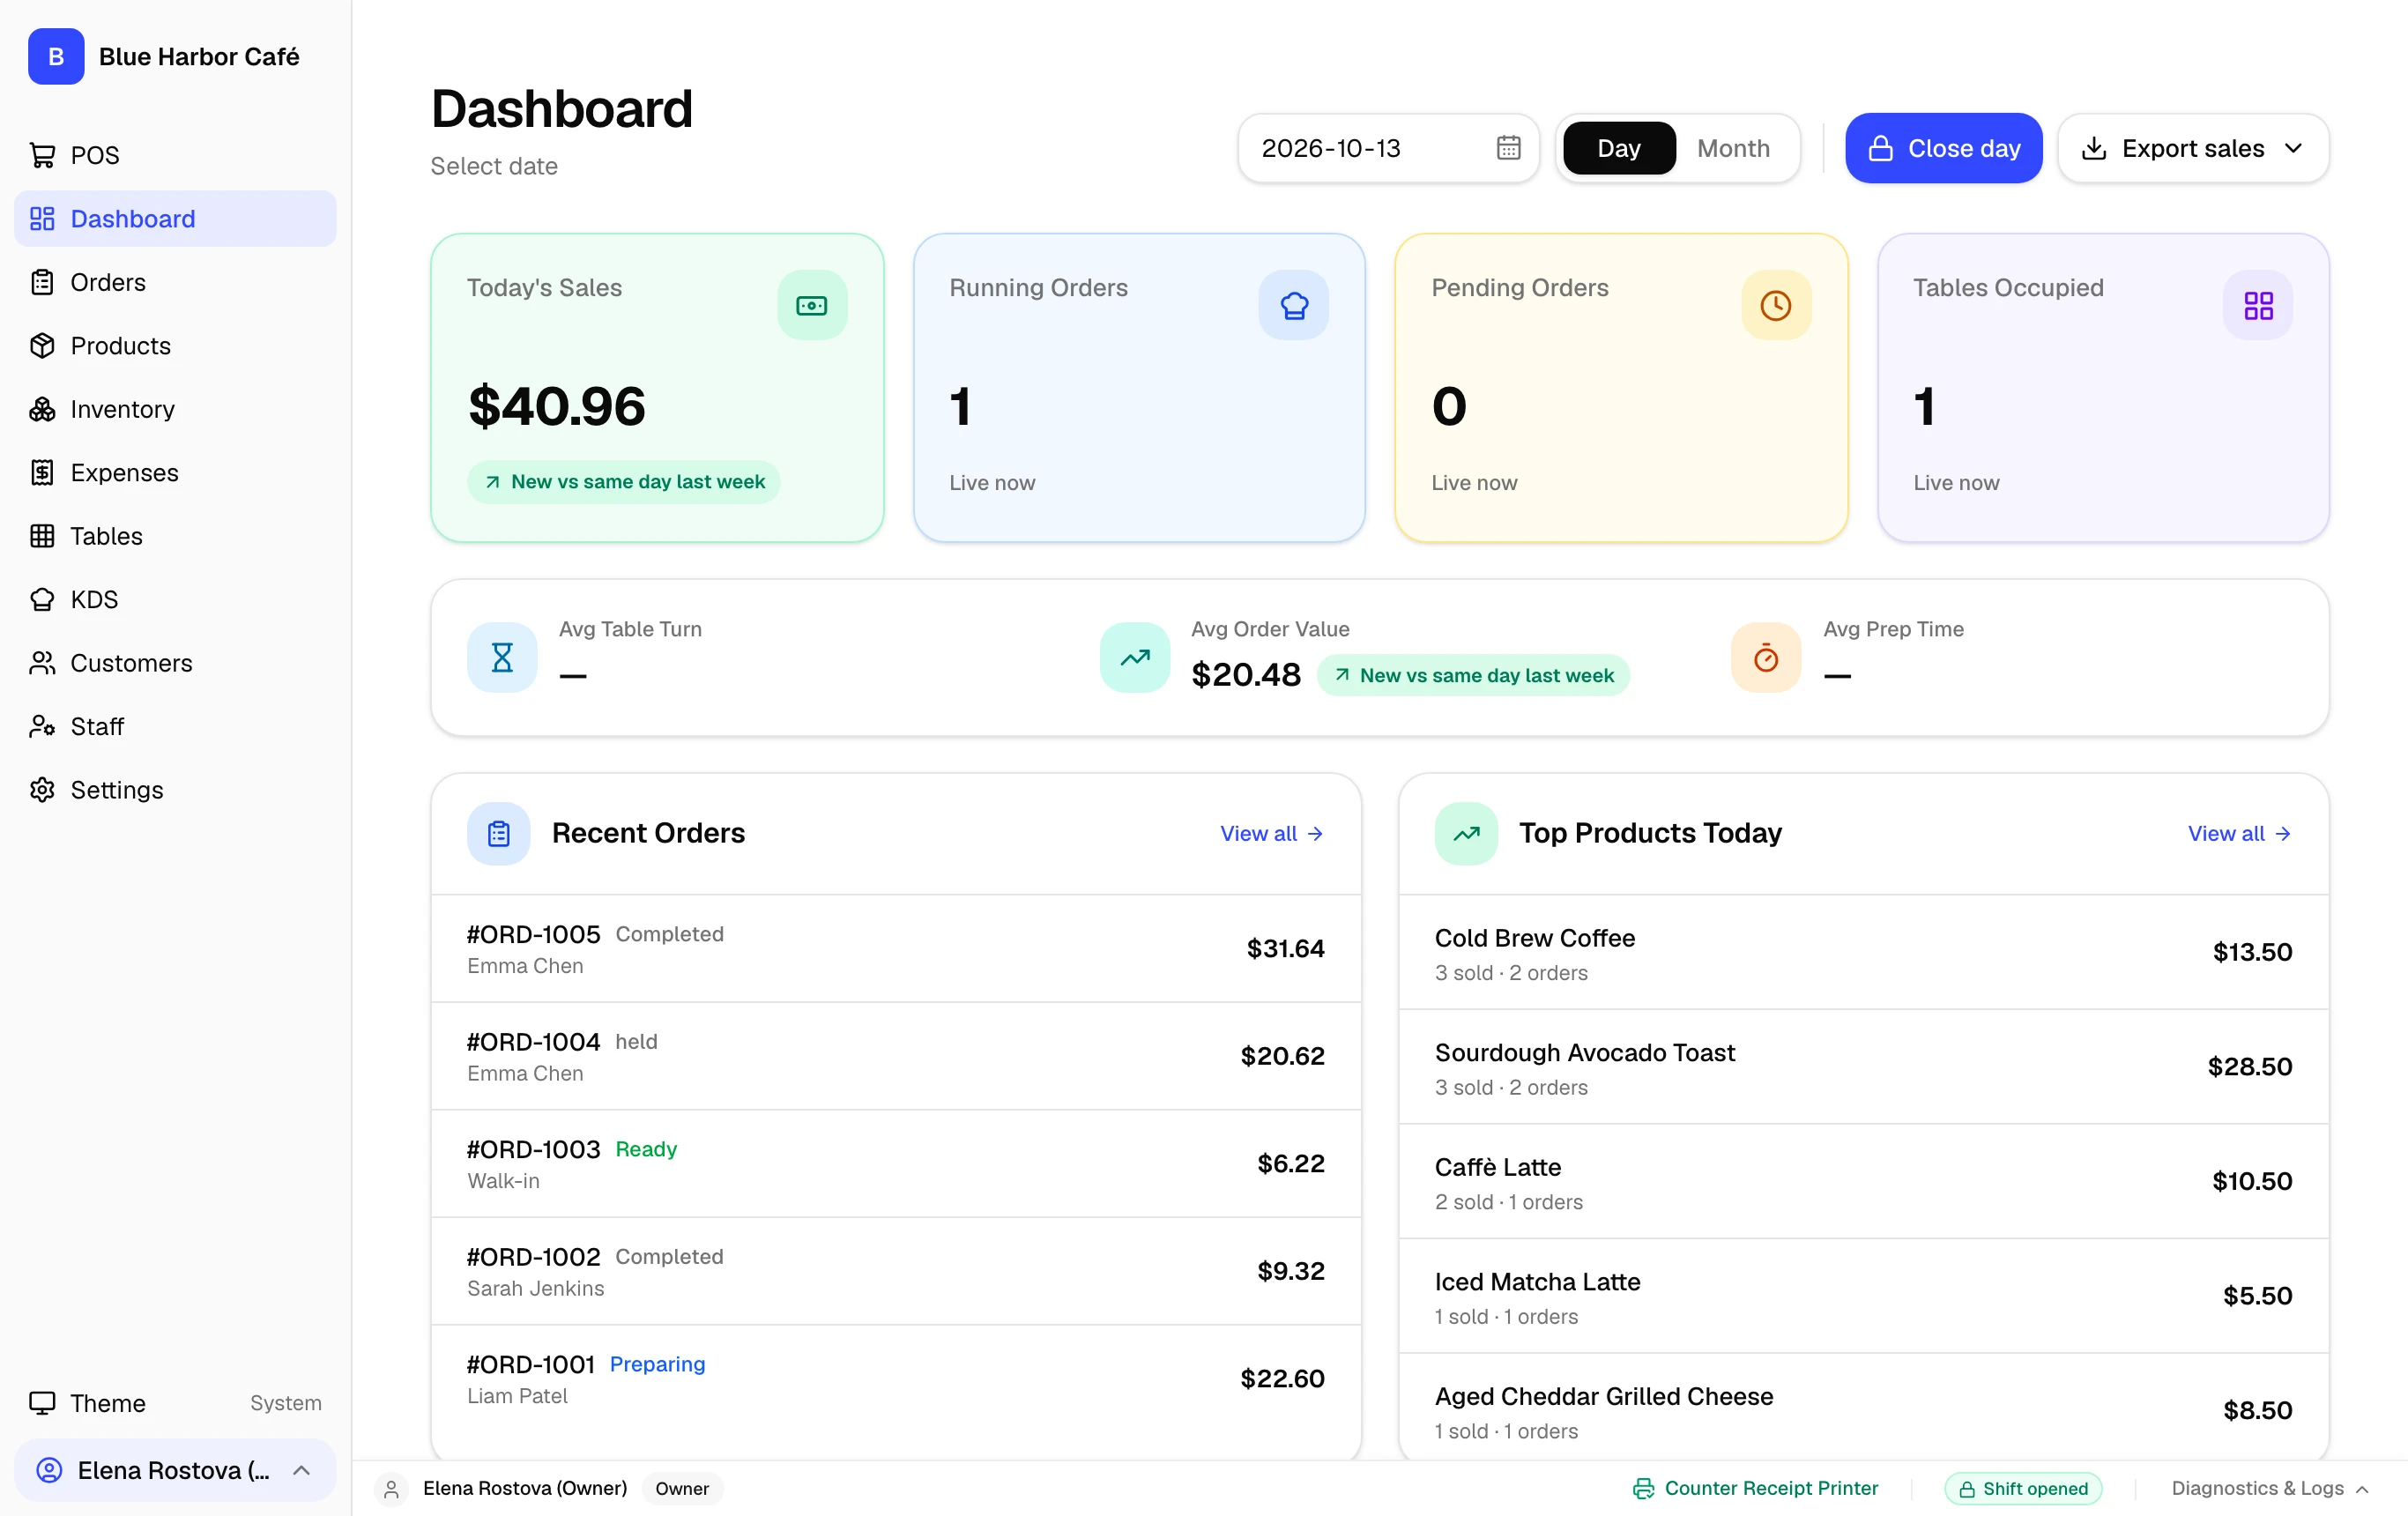
Key Metrics Explained
- Gross Sales: Total price of all items ordered before discounts and taxes.
- Net Sales: Revenue after deducting discounts and returns.
- Taxes Collected: Total 13% HST collected on behalf of the tax authority.
- Average Check: Total sales divided by number of completed orders.
- Tender Breakdown: Exact split between Cash, Card, and digital payments.
Step-by-Step Walkthrough
Follow these instructions in sequence to complete the setup:
1
Navigate to Dashboard
Click Dashboard in the left sidebar navigation.